

TikTok engagement rate is useful only when the formula is clear. A creator can look weak by follower count and solid by views, or the opposite, because TikTok distribution often comes from the For You feed instead of existing followers.
For 2026, a practical benchmark is simple: 2-4% is typical, 4-6% is good, and 6%+ is standout when the same formula is applied to a recent set of posts. The number should be judged with niche, account size, watch time, shares, and audience quality, not in isolation.
What TikTok engagement rate measures
TikTok engagement rate measures how often viewers react to a video. The most useful version for creators is usually view-based:
Engagement rate = (likes + comments + shares) / views x 100
Some reports use followers instead of views. That can be useful for comparing accounts, but it can also distort TikTok performance because a high-performing video may reach many people who do not follow the creator yet.
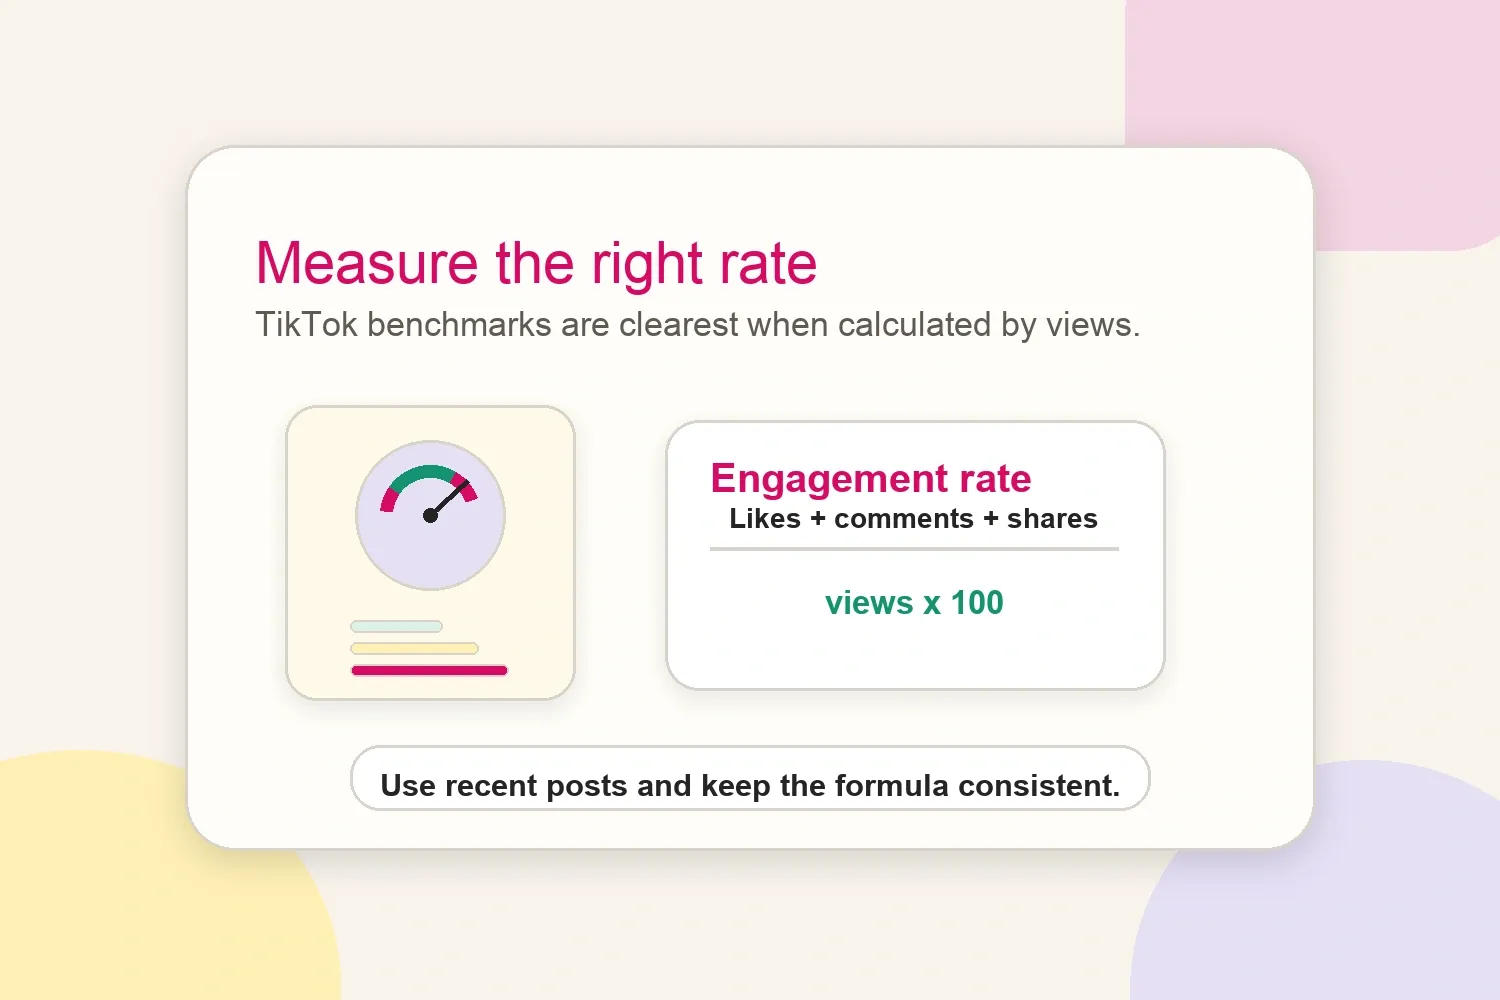
For day-to-day tracking, use the same formula every time and calculate it across the last 10 to 30 posts. Single viral posts and pinned videos can make the rate look better than the account really performs.
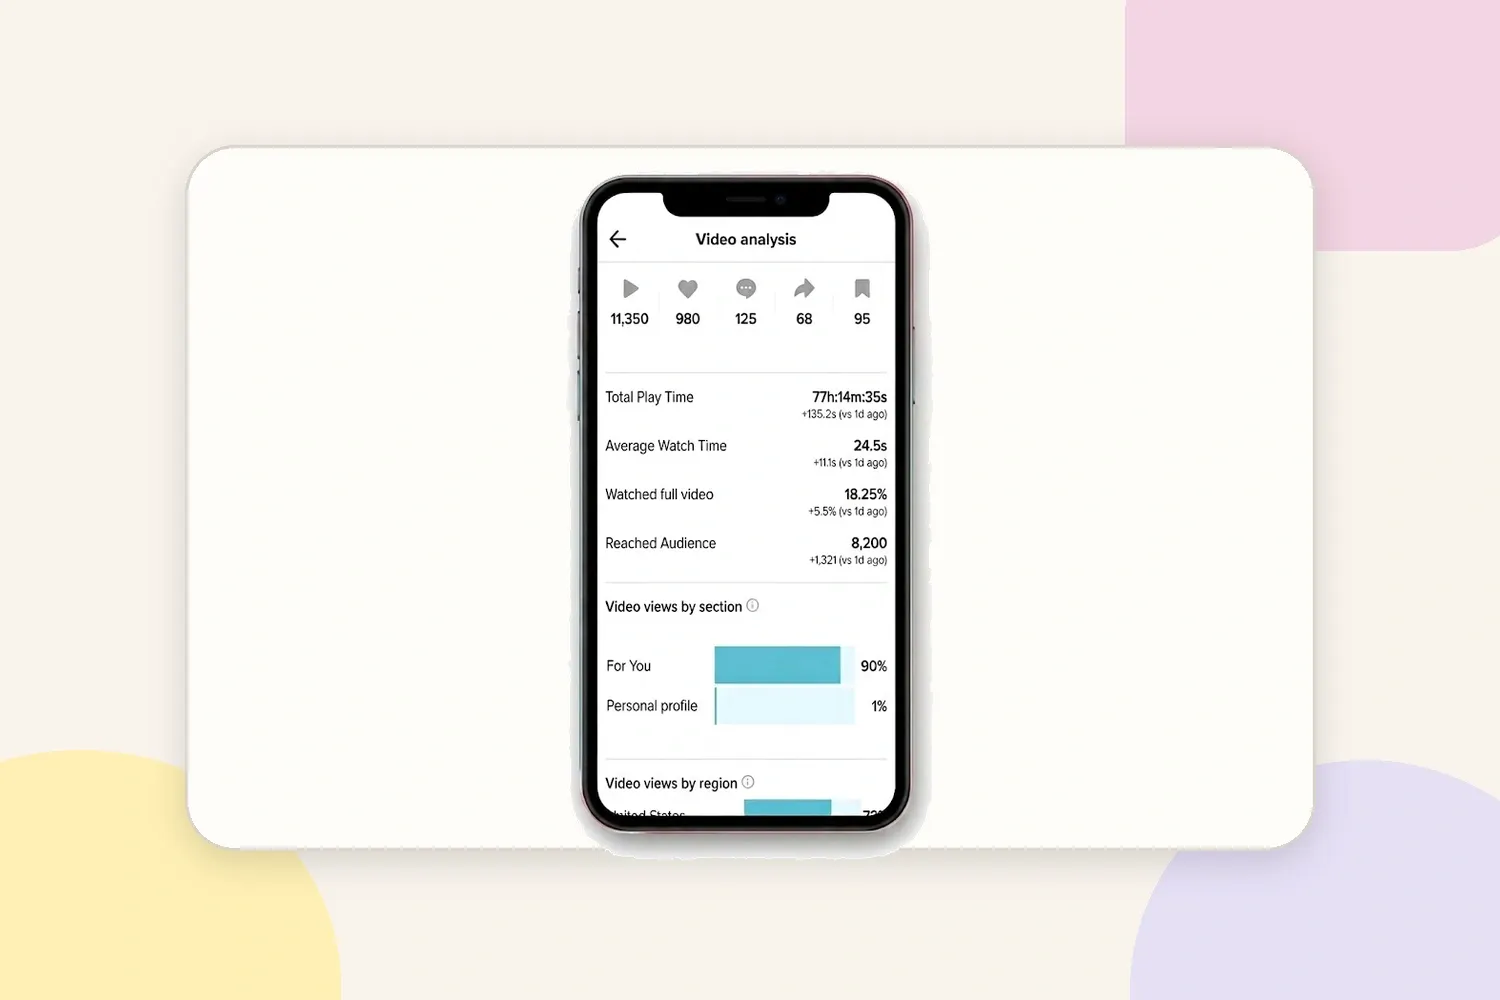
This is the kind of TikTok analytics screen worth checking before comparing benchmarks: it shows views, likes, comments, shares, saves, watch time, completion, reached audience, and where views came from.
Current TikTok engagement benchmarks
Different benchmark reports use different formulas, so the exact average changes by source. Socialinsider’s 2026 benchmark report places TikTok’s engagement rate by followers around 2.60% and notes that shares on TikTok increased sharply year over year.
Dash Social’s TikTok benchmarks show a higher average for brands, with about 3.4% engagement by followers and 4.4% engagement by views. That does not mean one number is universally correct. It means the formula matters.
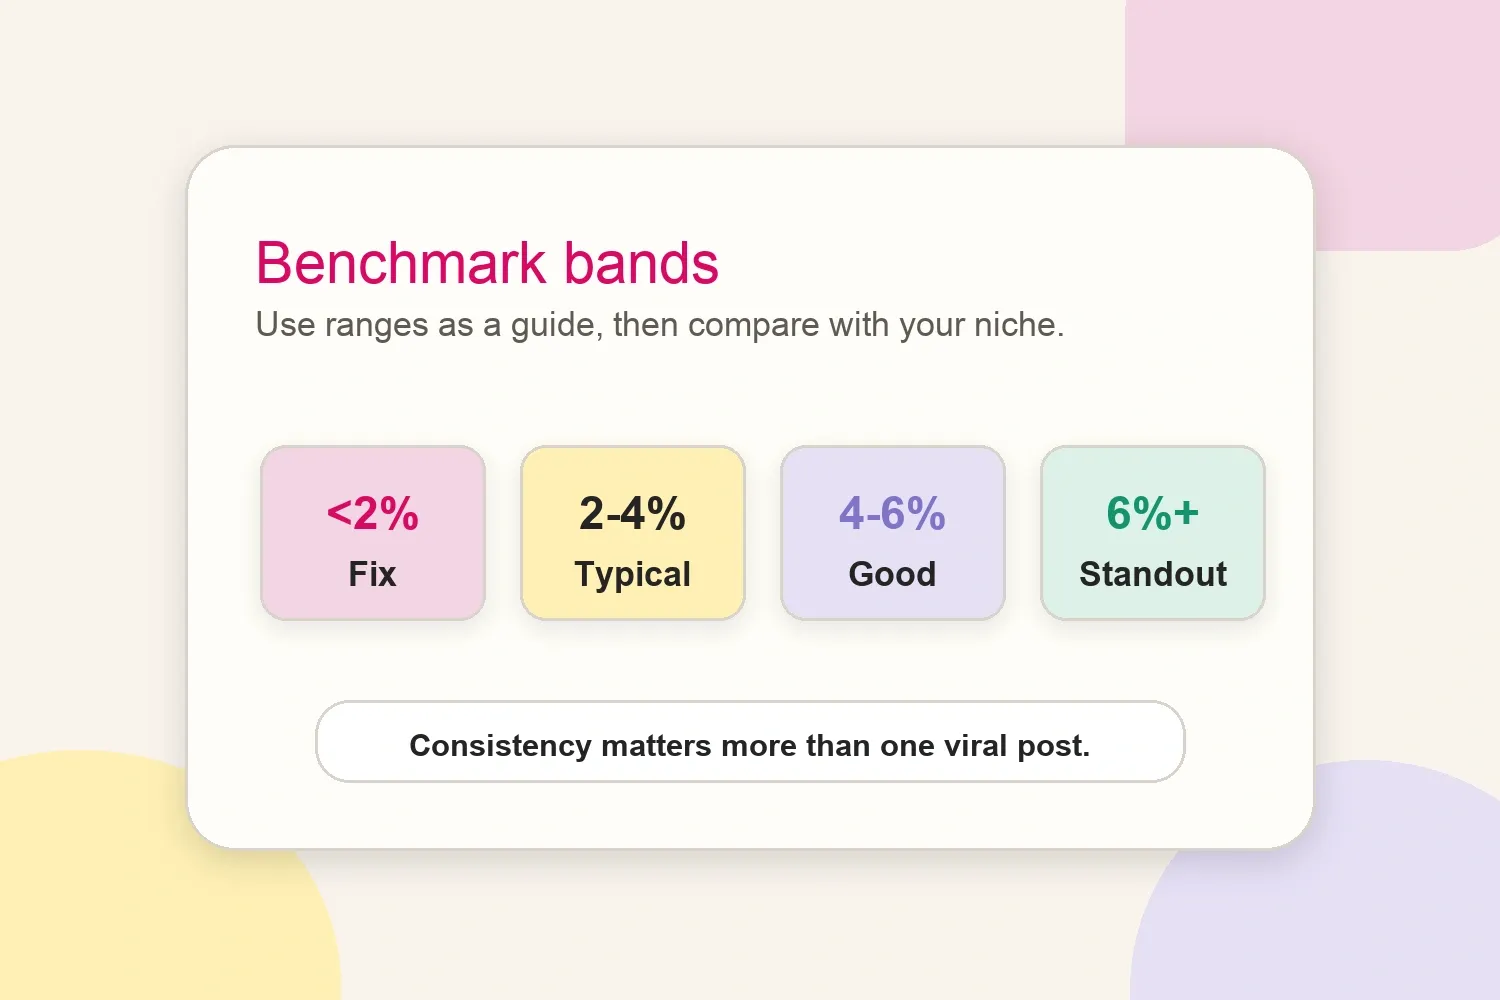
Use these ranges as a working guide:
- Below 2%: something needs diagnosis, especially if views are also flat.
- 2-4%: normal or solid performance for many accounts.
- 4-6%: good performance, especially when repeated across several posts.
- 6%+: standout performance, often seen with niche communities, useful tutorials, polarizing opinions, or highly shareable videos.
Benchmarks by account size
Small accounts often show higher percentages because their audience is tighter and early followers are more invested. Large accounts may have lower engagement rates but still deliver more total comments, shares, clicks, and sales.
For nano and micro creators, a 6%+ rate can be realistic when content is specific and the audience is active. For larger creators, a lower rate can still be valuable if the audience is relevant and the absolute number of qualified interactions is high.
This is why brands should not buy on engagement rate alone. A creator with a well-structured influencer media kit should separate TikTok views, comments, shares, saves, clicks, and sales instead of hiding every platform inside one average.
Benchmarks by niche and content type
Engagement also changes by niche. Entertainment, food, beauty, health, education, creator tips, and product reviews can behave very differently. A short reaction video may earn many comments, while a tutorial may get fewer comments but more saves and profile visits.
The most useful comparison is not TikTok versus the whole internet. It is a creator’s current TikTok posts versus similar creators, similar formats, and the creator’s own last 30 posts.
What brands should check before judging a rate
Brands should look at the rate, then check the quality behind it:
- Are comments specific or generic?
- Are shares growing, or only likes?
- Are views coming from the right country and audience?
- Does the creator repeat performance, or rely on one viral post?
- Do posts lead to profile visits, link clicks, saves, or sales?
Engagement is a signal of attention. ROI comes from what that attention does next. For revenue planning, TikTok engagement should be read alongside payout assumptions from a TikTok money calculator and the creator’s actual conversion data.
How to improve TikTok engagement rate
The fastest fixes usually come from the first three seconds, the reason to keep watching, and the reason to respond. A clearer hook can lift retention, but a clearer payoff lifts comments, shares, and saves.
Useful improvements include:
- Open with the outcome, tension, or question before giving context.
- Make one point per video instead of mixing several ideas.
- Use captions that add meaning, not just repeated speech.
- Ask for a specific response when a comment would genuinely help the discussion.
- Turn useful comments into follow-up videos.
- Track performance by format, not only by posting day.
After each test, measure again with the same formula. The TikTok engagement rate calculator can help keep the math consistent when comparing several posts.
Common benchmark mistakes
The biggest mistake is comparing numbers calculated in different ways. A view-based TikTok engagement rate is not the same as a follower-based Instagram engagement rate, and neither should be compared to a single viral post.
Another mistake is treating likes as the whole story. Shares, saves, profile visits, and qualified comments often say more about value than a large but passive like count.
Bottom line
A good TikTok engagement rate in 2026 is not one fixed number. Use 2-4% as typical, 4-6% as good, and 6%+ as standout, then adjust for formula, niche, account size, and business goal.
The best benchmark is consistent improvement across recent posts. If views, comments, shares, and downstream actions are moving in the right direction, the engagement rate is doing its job.