


Presenting Instagram Story analytics for brands is not about sending every screenshot in the insights tab. It is about helping the brand understand what the sponsored Story delivered: who saw it, how people reacted, where attention moved, which actions happened, and what the creator learned from the audience response.
Stories are short-lived, fast, and often more conversational than feed posts or Reels. That makes the recap important. A brand may not see every frame live, and the campaign manager may need to forward results to a founder, client, agency, or paid media team. The creator's job is to turn Story analytics into a clear recap that is easy to trust and easy to use.
Instagram Story analytics for brands should answer campaign questions
The first mistake is treating every Story metric as equally important. Brands do not need a raw export from the insights tab. They need the numbers that connect to the campaign goal.
A sponsored Story recap should usually answer five questions:
- Did the Story reach enough relevant people?
- Did viewers stay interested through the frames?
- Did the audience reply, tap, vote, click, or take another action?
- Did the creator publish the agreed frames, tags, stickers, and disclosure?
- What should the brand understand before planning the next campaign?
That is the difference between a pile of screenshots and a useful report. The screenshots prove the work happened. The explanation helps the brand understand what the numbers mean.
Instagram explains that creators can view insights for individual Stories through the Story activity and insights view in its Story Insights help page. Instagram's broader Insights overview also frames insights as a way to review performance across content formats. For a brand recap, the practical point is simple: use platform screenshots as proof, then add context in plain language.
Start with the campaign goal before listing numbers
Before sending analytics, identify what the Story was supposed to do. The same metric can mean different things depending on the goal.
If the goal was awareness, the brand will care most about reach, impressions, completion, and whether the right audience saw the content. If the goal was traffic, link clicks and sticker taps matter more. If the goal was feedback, replies, poll votes, question box answers, and DMs may be the most useful signals.
For example:
- A skincare brand launching a new product might care about reach, profile visits, replies asking about skin type, and link clicks to the product page.
- A fitness app campaign might care about Story taps, link clicks, trial-code use, and replies from followers asking about the workout plan.
- A local event sponsor might care about location fit, sticker taps, countdown reminder taps, screenshots, and messages asking for dates or tickets.
The recap should reflect that goal. A Story with 400 link clicks does not need the same explanation as a Story with 2,000 poll votes. One shows traffic. The other shows audience feedback.
Share the Story frames first
A brand should not have to guess what went live. Start the recap by confirming the actual Story sequence.
Include:
- The live Story screenshots or exported frames.
- The publish date and approximate time.
- The number of frames delivered.
- The brand tag, paid partnership label, link sticker, discount code, poll, question sticker, or product sticker used.
- Any agreed wording, disclosure, or callout that was required.
This section is not only about proof. It gives the analytics context. A three-frame Story with a link sticker on the final frame will produce different click behavior than a one-frame Story with the link in the middle of the screen. The brand needs to see the structure before judging the numbers.
For creators managing multiple sponsored deliverables, this is also where a simple creator media kit or campaign proof folder can help. The point is not to make the recap complicated. It is to keep the final creative, screenshots, and results in one place.
Include the Story metrics brands actually understand
The best Story recap keeps the metric list focused. Do not bury the useful numbers under every possible tap, swipe, and profile action.
Numbers worth including:
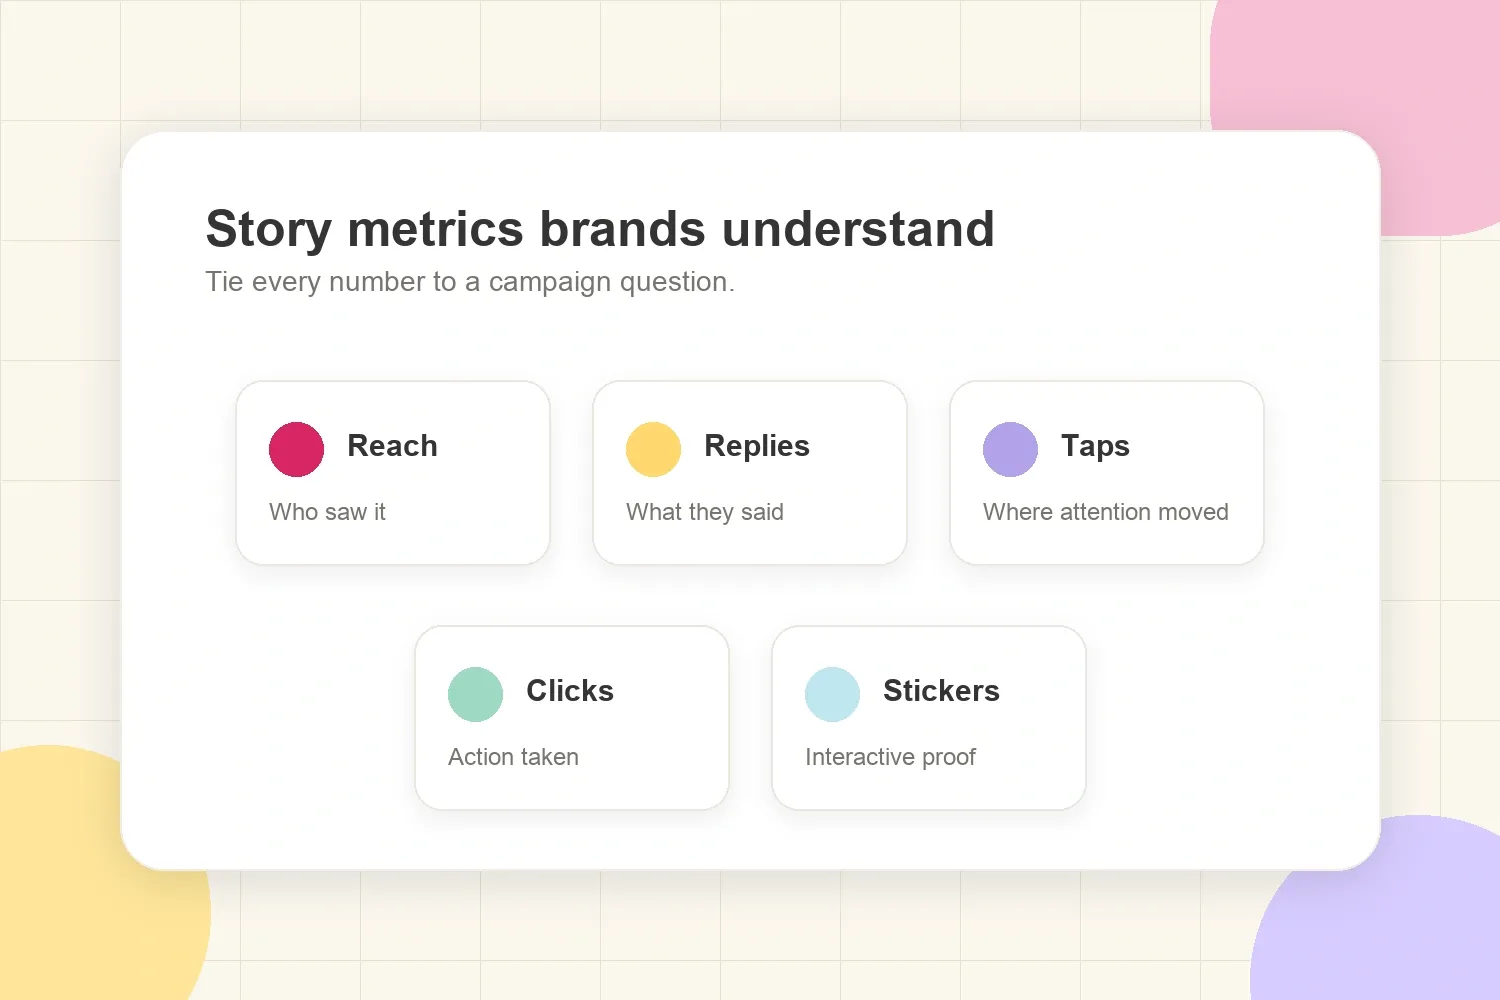
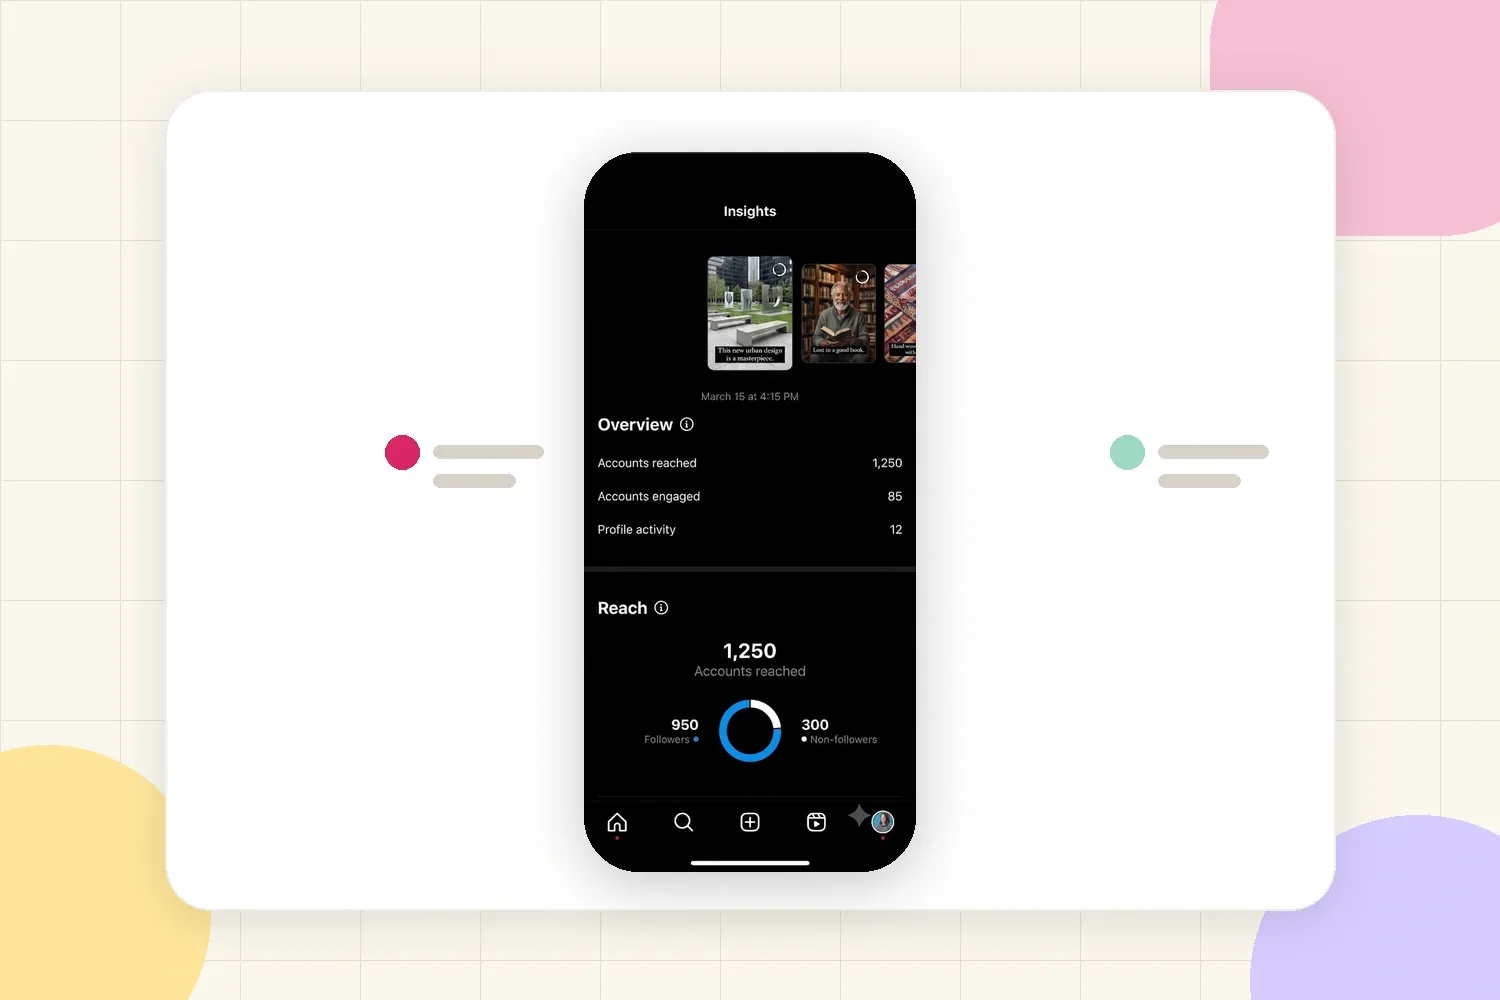
- Reach: how many unique accounts saw the Story.
- Views or impressions: how many total times the Story was seen, depending on what Instagram shows in the account's insights.
- Replies: how many people responded directly to the Story.
- Forward taps: how many times people moved to the next Story frame.
- Back taps: how many times people went back to rewatch the previous frame.
- Exits: how many people left the Story sequence from that frame.
- Link clicks or link sticker taps: how many people tapped the campaign link.
- Sticker interactions: poll votes, quiz answers, question replies, countdown reminders, product sticker taps, or other interactive actions.
- Screenshots: when available or visible, how many viewers saved the Story visually.
The brand does not always need every one of these. Pick the metrics that match the campaign. A traffic campaign needs clicks. A research-style campaign needs replies and poll responses. A launch campaign may need reach, screenshots, sticker taps, and message themes.
Explain reach without overselling it
Reach is usually the first number brands look at because it answers a simple question: how many people saw the sponsored Story?
But reach alone does not prove that the Story worked. A high-reach Story can still have weak clicks or low replies. A smaller Story can perform well if the audience is highly relevant and takes action.
When reporting reach, add one sentence of context:
- "Reach was close to the creator's normal Story range for this day of the week."
- "Reach was lower than the previous Story set, but link clicks were higher because the offer was clearer."
- "Reach was concentrated in the brand's target market, which matters more than total volume for this local campaign."
That kind of note helps the brand avoid reading the number in isolation. It also shows that the creator understands performance, not just screenshots.
Use taps to explain attention
Story taps are easy to misread. A forward tap does not automatically mean the frame was bad. Viewers naturally tap through Stories, especially when they already understand the message. A back tap can be more interesting because it may show that someone wanted to rewatch, reread, or check a detail again.
The useful way to present taps is by frame:
- Frame 1: reach and first attention.
- Frame 2: whether people stayed with the story.
- Frame 3: link, sticker, or action behavior.
If one frame had unusually high forward taps, explain what might have happened. Maybe it was too text-heavy. Maybe the hook was clear and people moved to the product frame. Maybe the link was on the next frame, so tapping forward was part of the intended path.
Do not turn taps into a dramatic conclusion without context. Use them as attention clues.
Treat link clicks as action, not the whole ROI story
For many sponsored Stories, link clicks are the number the brand cares about most. They show that viewers did more than watch. They moved toward a product page, signup page, event page, discount code, or campaign landing page.
Still, link clicks are not the whole ROI story. A viewer might click and buy later. Another might screenshot the Story, search the brand later, reply with a question, or save the discount code. The creator should report clicks clearly, but avoid pretending that Instagram Story analytics alone can prove every sale.
A useful format:
The Story sequence generated 1,860 reach and 143 link clicks. The link appeared on frames 2 and 3, with the highest click activity after the product demo frame. Replies mostly asked about sizing and shipping, which suggests the audience understood the offer but needed purchase details.
That tells the brand more than "143 clicks." It connects the action to the creative and audience response.
Show replies and sticker interactions as audience feedback
Replies, polls, question stickers, emoji sliders, quizzes, and other sticker interactions can be more valuable than they look. They show what people asked, liked, doubted, or wanted next.
Brands often care about this because it feels closer to customer research than vanity metrics. If viewers ask the same question five times, that is useful product feedback. If a poll gets a high number of votes, the brand can see which message, shade, flavor, feature, destination, or offer created interest.
Useful ways to summarize replies and sticker interactions:
- "Most replies asked whether the product works for sensitive skin."
- "Poll votes leaned toward the lighter shade, which may help the brand choose which product to feature next."
- "Several viewers asked if the code works internationally."
- "Question sticker responses showed interest in a tutorial format, not only the product itself."
Avoid forwarding private DMs directly unless identifying details are removed and sharing is appropriate. A short summary of recurring themes is usually safer and more professional.
Include screenshots, but keep them organized
Screenshots matter because Story analytics can disappear, shift, or become harder to access later. Brands often need proof for internal reporting, especially when Stories were part of a paid campaign.
Send enough proof to make the recap credible:
- One screenshot of each live Story frame.
- One analytics screenshot per important frame, or one combined view if the platform shows it clearly.
- Screenshots of link sticker taps, poll results, question responses, or other important interactions.
- Screenshots of notable audience replies with names and profile photos removed when needed.
- A short label for each screenshot so the brand knows what it is looking at.
Do not attach twenty unlabeled screenshots and expect the brand to make sense of them. A clean recap can include screenshots, but the message itself should still summarize the results.
Write the recap so a brand can read it in one minute
A good Story analytics recap should be short enough to read quickly and specific enough to be useful. Think of it as the campaign receipt plus the creator's interpretation.
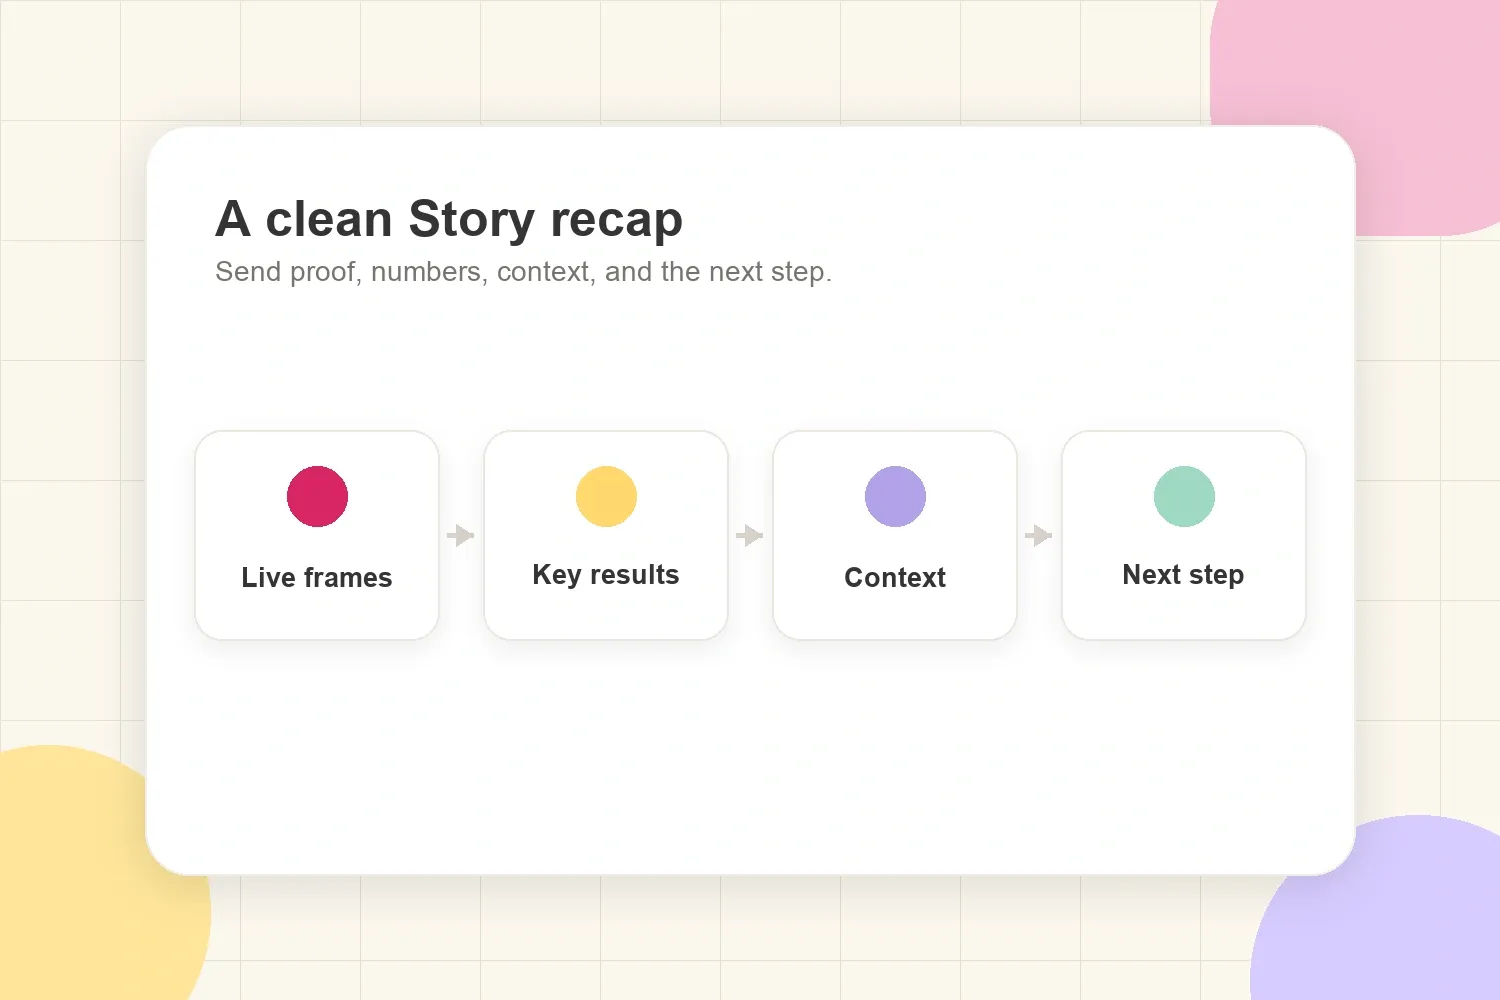
Use this structure:
- Live content: link or screenshots of the Story frames.
- Delivery proof: date, number of frames, tags, disclosure, sticker, link, and required campaign elements.
- Key results: reach, views/impressions, replies, taps, clicks, sticker interactions, screenshots, and any metric tied to the campaign goal.
- Context: one or two notes explaining why the numbers look the way they do.
- Next step: final report date, extra screenshots, usage-rights conversation, follow-up Story idea, or renewal angle.
Use a simple Story analytics message template
Here is a practical format a creator can adapt:
Hi [Name],
The sponsored Story sequence for [campaign/product] went live on [date] at [time]. The live frames and analytics screenshots are attached.
Delivery recap:
- [Number] Story frames published
- Included [brand tag / disclosure / link sticker / code / sticker]
- Link sticker appeared on [frame number]
Early results:
- Reach: [number]
- Views or impressions: [number]
- Replies: [number]
- Link clicks / sticker taps: [number]
- Poll votes / question responses / screenshots: [number, if relevant]
Quick context: [one or two sentences explaining audience response, the most useful frame, a common reply theme, click behavior, or posting time].
The main audience signal was [short insight]. Based on that, a useful next step could be [follow-up Story, FAQ frame, usage rights, final report date, renewal idea, or additional screenshot delivery].
Best,
[Creator name]
This format works because the brand can see the content, confirm delivery, read the key numbers, and understand the audience reaction without digging through attachments.
It also fits naturally with a broader post-campaign message. If the Story was part of a bigger campaign with a Reel, TikTok, carousel, or feed post, the creator can combine the Story recap with a full post-campaign report to the brand.
What not to do when presenting Story analytics
The common mistakes are not complicated. They usually come from sending too little context or too much unorganized data.
Avoid:
- Sending only screenshots: screenshots prove the numbers, but they do not explain the result.
- Reporting clicks without saying where the link appeared: frame placement changes click behavior.
- Ignoring replies: replies can reveal objections, questions, and buyer intent.
- Treating forward taps as failure: many viewers naturally tap through Stories.
- Hiding weak results: explain what happened and what might improve next time.
- Sharing private audience messages carelessly: summarize recurring themes or remove identifying details.
- Waiting too long to save proof: Stories are time-sensitive, and reporting is easier when screenshots are captured early.
A professional recap does not need to make every number sound impressive. It needs to make the campaign understandable.
Final take
Instagram Story analytics are useful to brands when they are presented as a campaign story, not as a raw dashboard. Start with the goal, show what went live, report the metrics that matter, attach proof, and explain the audience behavior behind the numbers.
The best recap is simple: live frames, key results, useful context, and one clear next step. That is what helps a brand see the creator as a reliable campaign partner, not just someone who posted a few Story frames.